
Work even more efficiently with our new BI dashboard.
Collecting data about your e-commerce logistics and then analyzing it, it sounds obvious.
Yet we find that a lot of our customers don’t do this regularly.
And because we benefit from well-performing webshops, we have developed a brand new BI dashboard.
With this easy-to-understand dashboard, we want to give our customers easy access to information that we generate by analyzing their specific data.
What is a business intelligence dashboard?
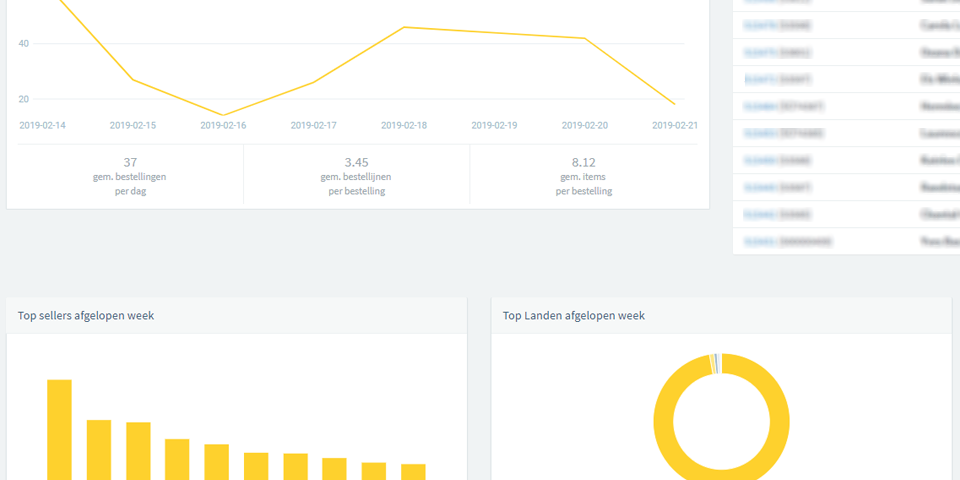
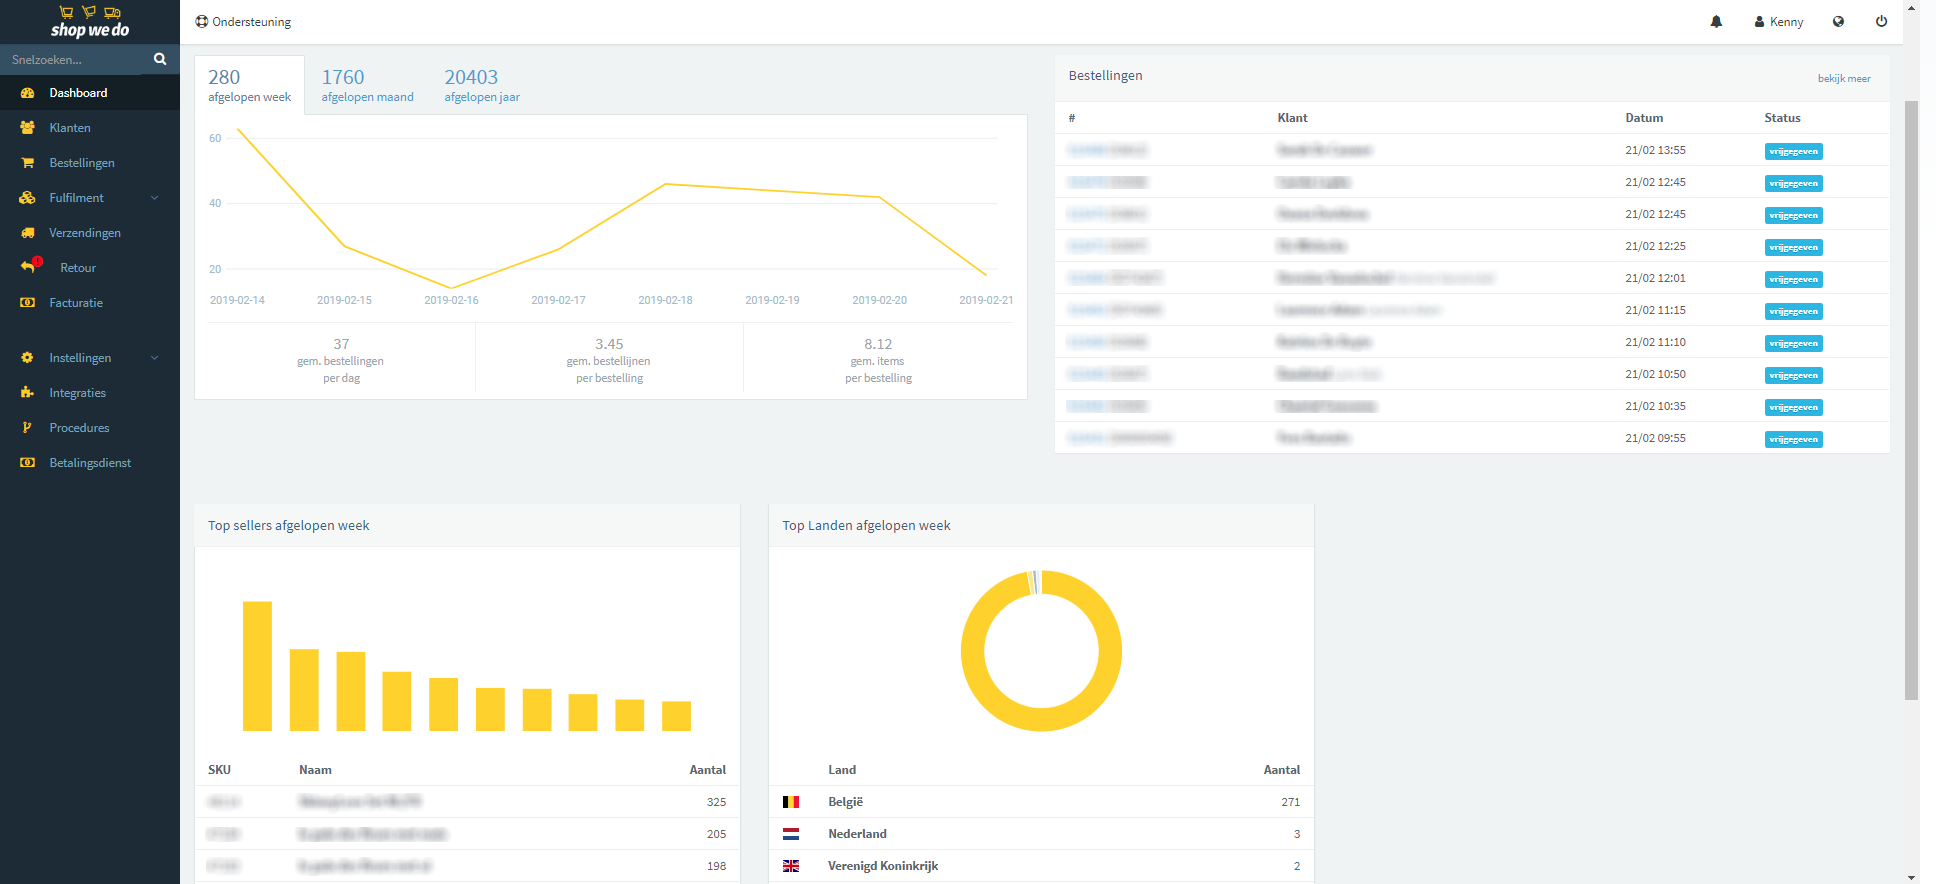
A BI dashboard is a visual tool that displays complex information to you in an understandable way.
In doing so, you can use various graphs and statistics.
You have the ability to down drill and view specific information in detail.
This gives you a perfect overview of, for example, sales, order sizes, your bestsellers or other variables of your e-commerce within a certain period of time.
In short, a BI dashboard reveals whether your business is successful or not and where it currently stands.
The benefits of our BI dashboard
- Easy transparent access to your numbers and KPIs.
By crossing logistics data from different data sources, we provide a status of your e-business at a glance. - Real-time updates.
Your data is kept up-to-date in real time.
So you will always see the latest data analysis on the ShopWeDo dashboard. - Mobile available.
The dashboard can be accessed anywhere in the world, including on your cell phone.
Customization possible
When you log into our online WMS platform, you can immediately get acquainted with the new BI dashboard for free.
Do you still need specific statistics or data analysis?
Know that everything is possible.
So don’t hesitate to contact us.

